5 AdWords Reports You Should Always Monitor 07 Dec 2016
Monitoring your AdWords campaigns is really important because it tells you whether each campaign is meeting your goals or not. It also gives you opportunities for improvement. Many advertisers just spend their time looking into basic metrics that they get by default in their campaigns. But there are more reports that you can use to view useful insights, helping you optimize your campaigns.
Below is the list of 5 important AdWords reports that you should always monitor:
Auction Insights Report:
The Auction Insights report shows you what percentage of impression share you get and how often you show up on top results compared to your competitors. You can also review the sites that show up along with your ads for your keywords. This gives you an idea of how much more you can improve to get more impression shares.
For example, if you have 50% impressions share, you can take it to 70% or 80% by figuring out whether it’s a problem about the budget, the bid, or other factors.
You can access this report at the keyword tab by clicking on ‘details’,going to Auction Insights, the choosing ‘All’.

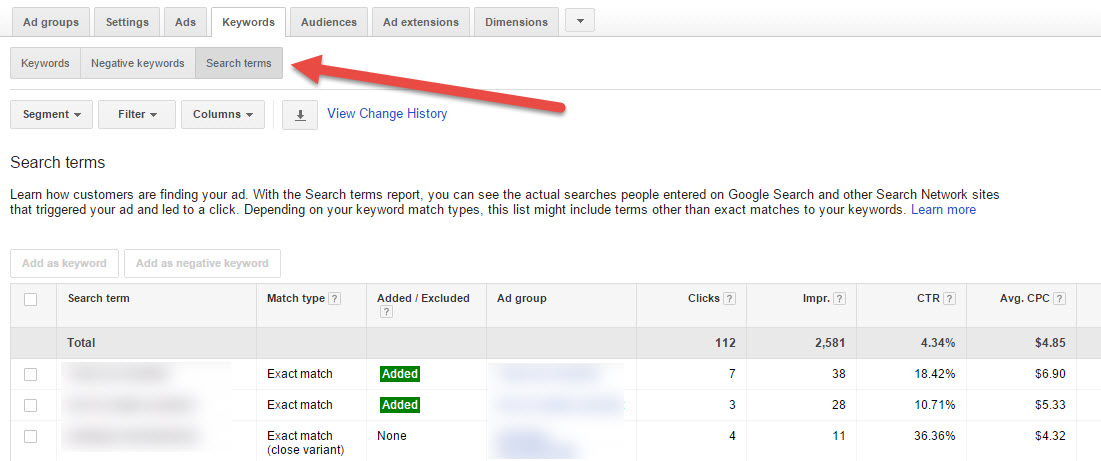
Search Query Report:
This is a very important report that shows you what actual search terms are used when yourad shows up. You may have the keyword ‘accident lawyer’ as a broad match or a phrase match, and there is a chance this keyword would show up for ‘car accident lawyer’, ‘accident attorney’, or ‘car accident lawsuit’.This is why monitoring the search query report is very important.
It also gives you the opportunity to find new keywords that are currently not in your keywords list. This is also a great way for you to find negative keywords so your ads do not show up when these are typed in.
Competitive Metrics:
These are very useful hidden columns that are not visible in your campaigns by default. You can add them by going to the columns option and then clicking on ‘Modify columns’.
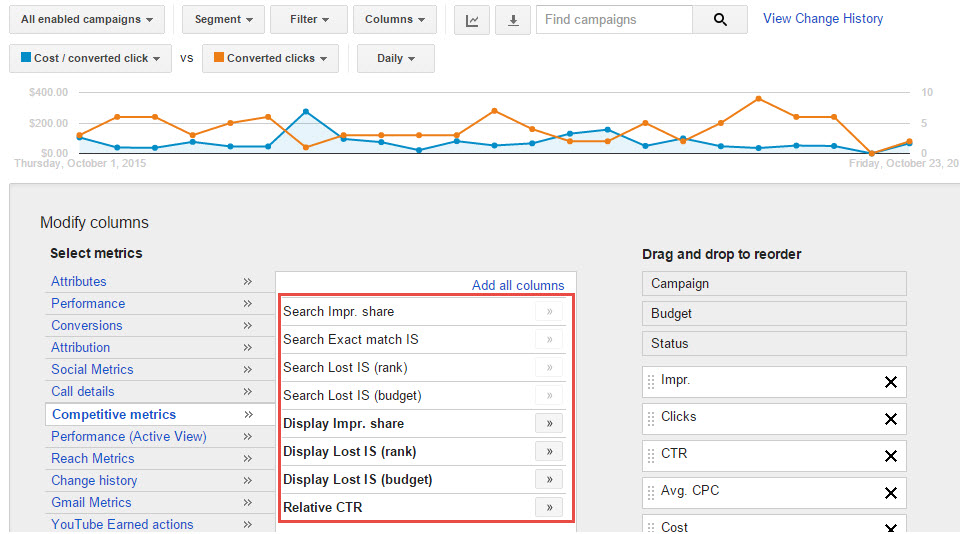
- Search Impr. Share:
This tells you the percentage of impressions you have received for your ads compared to your competitors. The closer you are to 100%, the more impressions you receive. However, if you get less than 50% or any number close to it, then this shows you are missing out on a large number of impressions.
- Search Exact Match IS:
This is the same as the Search Imp. Share metrics. The only difference is it only focuses on exact match keywords.
- Search Lost IS (Rank):
This tells you the percentage of impressionsyou missed due to low ad rank. If you see a higher percentage, then you should consider increasing your bid to increase your ad rank. You can also work on improving the quality score of your keywords.
- Search Lost IS (Budget):
This tells you the percentage of impressions you missed due to your budget. If you see a higher percentage, then you have to increase your budget. Remember if you run out of budget too quickly, your ads will stop serving.
- Display Impr. Share:
This is the same as Search Impr. Share, but it focuses on display network impressions instead of search network impressions.
- Display Lost IS (rank):
This is the same as Search Lost IS (rank) but it only focuses on the display network instead of the search network.
- Display Lost IS (budget):
This is same as Search Lost IS (budget) but it just focuses on the display network instead of the search network.
- Relative CTR:
This very useful column tells you how your ad performs compared to other ads running on the same page on the Google Display Network. The higher the number, the better your ads are performing compared to other ads.
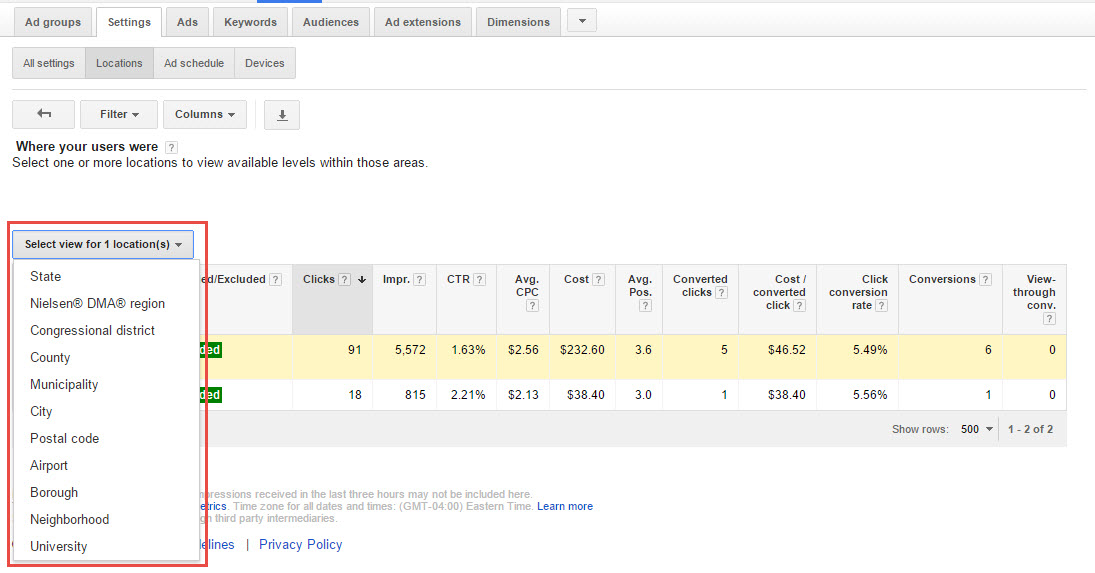
Location Reports:
Finding out and monitoring where you are receiving clicks and conversions from is important. This gives you a huge opportunity for improvement.
Once you find out where the clicks and conversionsare coming from, you can increase your bid to get more clicks and conversions in that area and reduce the bid for the cities or regions from where you receive no conversion at all. You can access these reports from the ‘Locations’ tab. From there, view ‘location reports’and choose ‘What triggered your ad (geographic)’ or ‘Where your users were (user locations)’. You can also view additional information like cities, counties, regions, postal codes, etc.

Devices Report:
Since mobile searches are increasing, it has become more important to monitor mobile and desktop performance. Users behave differently ondifferent devices,so it is essential you review the performance according to these different behaviors as well. These can be tracked through the devices report, which shows the performance of your campaigns on desktop, tablet and mobile.
You can also adjust your bid for mobile devices. If you noticedyou are not performing well on mobile, you should increase your bid to a range that would allow you to be in the top 2 positions.Of course, this may cost you a bit more compared to desktop CPC due to less space and more competition.

Author Bio:
David Chapman is the Director of Sales and Marketing at Webrageous Studios, a PPC Management Company based out of Reno, Nevada. His expertise in PPC comes from managing PPC accounts with monthly budgets in the range of $30,000 – $100,000 with a focus on mobile marketing.
|
Recommended posts
|
