
The Profitability of Facebook Ads 25 Oct 2016
Written by Meredith Boll
If Facebook Ads will be part of your social campaign strategy this holiday season, you’ll want to make sure you’re getting a solid return on your ad spend before you finalize your holiday marketing budget.
When it comes to Facebook advertising, it may not be as effective as you think. The team at Glew analyzed the return on Facebook ad spend to determine how profitable the channel is for ecommerce stores. The surprising results may cause you to take a second look at your social strategy this season.
Our Findings

In an analysis of over 7 million dollars in Facebook Ad Spend, our team discovered only 24% of companies turned a profit from Facebook advertisements, while three quarters of ecommerce stores, 75.8%, lost money.
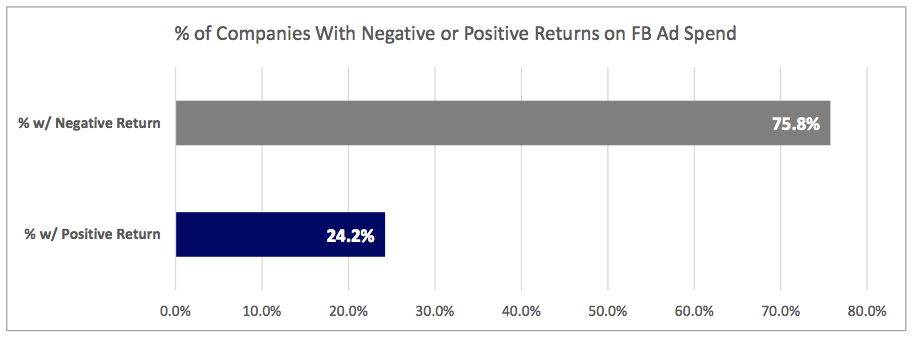
Our analysis showed an average return on Facebook ad spend of negative 20.7%.
The few companies that were successful at profitably using Facebook ads saw an average return on ad spend of 123.1%. But companies that lost money on ads ended up with a negative 66.7% return on spend.
Ad spend threshold showed that spending more doesn’t mean earning more. In fact, higher budgets resulted in lower returns.
Our Methodology
Glew analyzed the return on ad spend for ecommerce companies that spent at least $5,000 on Facebook Ads in 2015. Using our ecommerce analytics application, we applied a Last Click-First Order Attribution model to calculate conversions and the subsequent return on ad spend.
To validate our findings, we referenced Google Analytics (GA) for a second opinion. GA’s attribution model revealed an even lower return on ad spend, with an average return of negative 29.2%.
Insight into Facebook Ad Returns
The surprising results of our research made us question why ecommerce stores continue to spend money advertising on a channel with negative returns. We concluded that most marketers do not realize they are losing money.
You can avoid being left in the dark by understanding Facebook’s attribution model and following 4 strategies to gain a better understanding of your return on ad spend.
Facebook’s Attribution Model
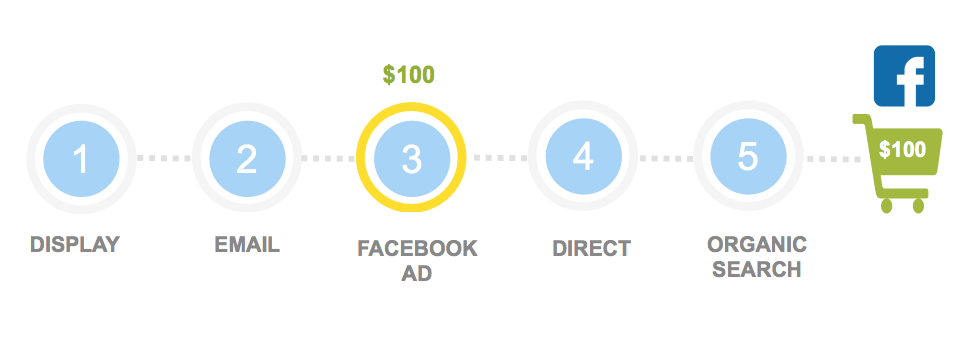
Facebook Ads will attribute any conversion back to their advertising if an ad has been shown to a user within 24 hours of a sale, or if an ad has been clicked at any time within 28 days of a sale.
This visual shows a customer’s buying path before a $100 dollar purchase and is an example of how Facebook attributes conversions. Each of the touch points represent an action taken before the sale. Since Facebook Ads was a touchpoint on the conversion path, Facebook would attribute their ad with the conversion.
4 Tips to Increase Insight into Ad Spend
- Report with a Second Source
A critical part of accurately analyzing ad return is getting data out of Facebook’s internal reporting. This is the paramount step in owning responsibility for your side of advertising. Use a third party reporting tool for your second source of data.
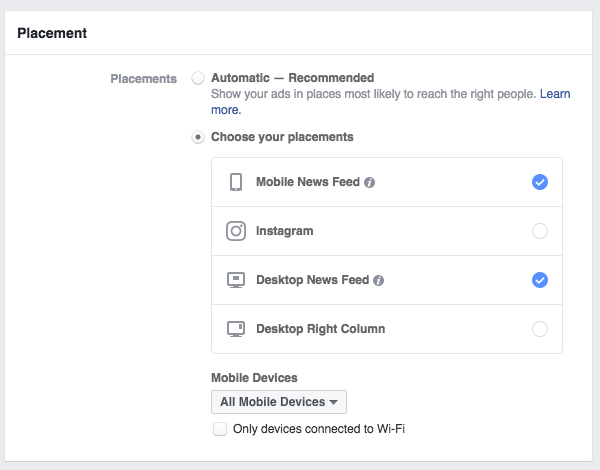
- Keep Instagram and Facebook Ad Campaigns Separate
Today, you can create Facebook ads and Instagram ads within the same campaign. It’s as easy as checking a box under “Placement” to run ads on both networks. Resist the temptation to do mix ads in the same campaign or your advertising data will be completely muddy.
Instead, create two duplicate campaigns – one for Facebook and one for Instagram. The only difference lies in the UTM tagging of Source, and the placement of the ads. This will allow you to separate data between the platforms and find a solidified approach to advertising.
- Evaluate Campaigns from a Different Attribution Model
In the First Click attribution model, the first touch point receives 100% credit for the conversion. Using the First Click attribution model can be a healthy way to evaluate performance of Facebook advertising. Because it puts credit in the channels that first brought in a customer, you can use it to see if your ads are bringing in new customers or just stacking on-top of other successful marketing strategies like email or display ads.
Google Analytics defaults to Last Click attribution, but you can review data using a different model by logging into Google Analytics and going to Conversions, Attribution, and Model Comparisons.
- Don’t Rely on Metrics Provided by Facebook
Like most paid advertising sources, Facebook employs the use of a tracking pixel in order to calculate conversions. A pixel is a small piece of code placed on a site that sends back data whenever someone takes an action from the pixel’s channel. Since a tracking pixel is owned and managed by the advertiser, they control the reporting on their own ads.
To best understand the performance of advertising revenue, marketing teams should eliminate reliance on advertiser provided metrics by using proper UTM tags on all paid links.
When a user clicks on a link that is tagged correctly, their source, medium and campaign are passed up into Google Analytics. Now you have flexibility to change around the attribution model, or slice and dice data in an informative way.
Follow these strategies to make sure you get the most bang for your buck during the busiest two months of the ecommerce year. Also remember to check your performance regularly and turn off ads that are burning money and not generating returns.
Author Bio:
Meredith Boll is a content creator at Glew, an ecommerce analytics software
provider, where she focuses on helping online stores understand and act on their
data. Each week she publishes practical strategies for ways to rock ecommerce success.
|
Recommended posts
|
